<img height="1" width="1" style="display:none;" alt="" src="https://dc.ads.linkedin.com/collect/?pid=204641&amp;fmt=gif">

SQL Server monitoring

Monitoring your servers is a natural part of a DBA's responsibilities and essential for delivering reliable and stable services. But are all SQL monitoring tools created equal?

This article concerns the why, what, and how to monitor SQL servers. With this knowledge in hand, you are better equipped to decide what you need from a monitoring tool and how to benefit from it.

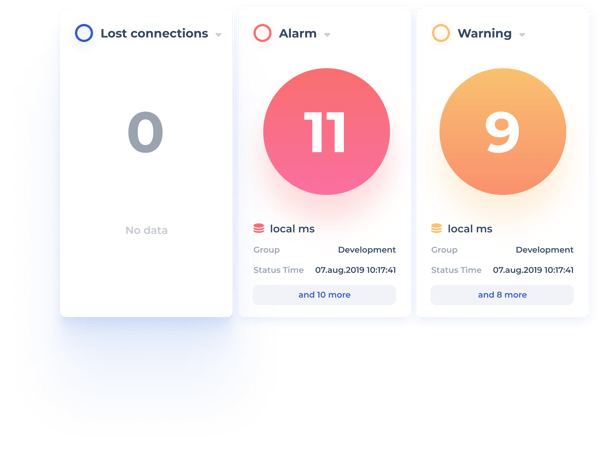
The first thing you want to do as a DBA is to see the status of the database instances you manage – and that’s where we start with SQL monitoring. With only a handful of instances, you may be able to do it by hand, but once the numbers start increasing, you will need some kind of tool or solution to help you. And that’s where you face the first question – what monitoring tool should I use?

There are many SQL monitoring solutions to choose from, or you can roll your own – so let´s talk about what is important and why when it comes to monitoring SQL servers.


features-status

Why Monitor SQL Server?

Monitoring in 5 steps

First, why do you want to monitor all those SQL instances? It may sound like a simple question, but let's look closer at some reasons for monitoring instances:

  1.  Status. Just so you know – the first thing you can think of is to see if the instance is up and running. You want an easy way to see if all is running.
  2.  Alerts. There is a large range of things that can go wrong, from server down, out of disk space/memory/CPU to lock and wait situations, jobs not running – the list is pretty much endless. You want to be alerted when any of these events occur. But still, this is reactive - you get alerted after the event has occurred.
  3.  Preventive action. You want to be notified before something goes wrong so that you can take preventive action. You will need to set thresholds for resources and performance and generate a warning when one of the critical parameters is moving toward or beyond the threshold. This will allow you to take corrective action before the system degrades or grinds to a halt.
  4. Actionable in-depth information. You would like to have detailed, useful information on each instance so you can understand the status and health and take corrective action. This is where we move from data: "Something is wrong" to information: "This is why there is a problem and what you will need to fix".
  5.  Helicopter overview and workflow integration. You want to see your entire estate's overall status and health, so you can understand the situation and prioritize your work. On larger sites, in particular, it can be hard to see where your time and attention are most needed. You will need much information on all instances and the ability to compare them to find where your time is best spent.

What to monitor?

It may be a simple question, but there is a lot you can monitor:

  • Scan networks to discover new database servers
  • Basic parameters to monitor, such as availability, CPU, memory, log files, and disk usage
  • More detailed parameters such as active sessions and transactions, queries, cache hit ratio, logical reads/sec, waits, locks, page reads/sec 
  • Dynamic views – active jobs, longest-running queries, services, and processes.
  • Your custom site or application-specific parameters. You may have certain parameters you want to watch related to a specific application or local situation.
  • Global views of the entire estate

Monitoring collects data. This needs to be stored to be used later for analyzing trends or reporting.

The more data you collect, and the more frequently you collect it, the more space you will need to store the data. So consider the following:

  • How detailed information do you need?
  • How frequently do you need to collect it?
  • What performance impact can you permit on your server?
  • Will the data collection affect your network traffic?
  • Where will the data be stored? Locally on each instance or in a central repository on a large SQL server?
  • How much server capacity do you need to store all the data?

When or how frequently to Monitor

Monitoring should be done continuously as long as the server is in operation.
Some parameters, like CPU load, should be monitored very frequently, like every second, to provide a good and detailed profile of the load on the server.
Other parameters, like disk space, can be monitored much less frequently.
For each parameter, we need to find the optimum frequency. Too frequently will produce a load on the monitored system and generate too much data to be stored. If more often is needed, data will be detailed enough to let you analyze and find the cause of a given problem.
It is a question of balancing resource usage vs. usefulness.

Turning data into actionable information

Monitoring solutions can collect a lot of data. More data leaves you overwhelmed, and looking for that needle of useful information in the haystack of raw data can be frustrating. Too little information can lead to an inability to locate issues or reach incorrect conclusions, which can be very costly.

If you collect too much data, you will run into two other problems as well:

  • You need to store the data. Too much data means you will build up a huge repository which may be administrative and cost challenge in the long run
  • All that data will load up your network and will slow down your analytical tools when you try to use the data to extract information.

Automation can scan through all that data and notify you only when something is out of the normal and needs your attention.

You will then need to turn the raw data into useful information that gives you insight into what's going on and what you can do about it.

What's important is how you present the data and how you can turn the data into useful, actionable information.

  • Instance analysis. Produce relevant information and insight on a single instance to understand what's going on and what needs to be done
  • Group analysis. If you run multiple instances on a virtual cluster (who doesn't?) you sometimes need to see all instances on the cluster under one to understand what's affecting the performance of the cluster as a whole.
  • Estate analysis. From time to time, you should take a bird's eye look at your entire estate and see if your resources are optimally allocated. Maybe there are servers and instances not being used or underutilized that can be freed up and reallocated to servers and instances that can benefit more from those same CPU/memory/storage resources. '
  • You should read  Optimizing SQL Server operations and Optimizing SQL server licenses for more insight into optimizing the server farm.
  • The data also forms the basis for performance tuning your servers. If you run in the Azure cloud, Azure database performance measurements look into topics unique to cloud databases.

Good monitoring tools should be able to automate most, if not all, of this for you.

Get started with dbWatch 30 day free trial

Monitoring operations

This may not be obvious, but monitoring can be a rather time- and resource-consuming exercise.

Consider the following:

  • What is required to set up the initial monitoring server? Hardware, underlying database, time to configure?
  • What is required for installing monitoring on a new server? Agents? Scripts?
  • If you at some later time want to apply a change or update to the monitoring on a server (add a new parameter, update software, change trigger value) – what is required? For one instance? For 50 instances?
  • Can you customize monitoring parameters, tasks, reports, frequency, and threshold values to fit your requirements?
  • How do you handle DBA access? Is it role-based? Can you log in and audit what the users are doing?
  • Monitoring is only half the equation. How easy is it to go from monitoring/viewing an instance to managing/fixing it? Can you switch seamlessly from monitoring to managing without switching consoles or logging in/out? Monitoring will be an essential part of your workflow, so it should be integrated into your workflow tools.
  • How easy/flexible is it to configure the distribution of alerts and reports? What about distributing to different persons/locations depending on the time of day/week?

For large estates, you have a few more things to consider:

  • How will the monitoring solution perform when you get into hundreds or thousands of instances? This topic is explored in database monitoring in complex networks and  performance issues to watch out for when monitoring complex networks
  • With hundreds or thousands of instances – how do the dashboards and views look? Is it still meaningful? Can you sort or prioritize them in meaningful ways so they still give you useful information?
  • Large estates are often split into multiple sites or networks behind various firewalls. How do you monitor across firewalls? Will you need to open many ports, or can you place a (sub) server behind the firewall so you can monitor each site or network locally and then consolidate up on a global level?
  • With a large estate, you will usually need more secure means of access and privileges. Can you configure this easily?
  • With many instances, you will need a way to name, group, and tag instances in a meaningful manner so that you can search/view on function, location, department, version, platform, or any other user-defined property.

Take monitoring to a new level

You can perform monitoring on many levels, from the basic manual methods to fully automated enterprise-class monitoring and integrated management solutions. 

Level 1: Basic monitoring

For this level, almost anything will work. Simple scripts, any infrastructure monitoring platform, and even manual monitoring can work.

Level 2: Scripted monitoring with basic alerts

For this level, simple monitoring solutions with checks and alerts can function. We also see many roll-your-own scripts being used here.

Level 3 and up: Advanced monitoring schemes

Here things get more complicated. A lot more parameters are checked and checked more frequently. Values are compared to thresholds and alerts or warnings generated when required. This can quickly become too complicated for roll-your-own solutions, and manual monitoring is no longer realistic.

If you are aiming for preventive action, you should also consider a robust maintenance solution. Rather than wait for an alert that suggests you take action – be proactive and run some good maintenance scripts.

So for level 3 and up, you are most likely looking at a 3rd party monitoring/management solution.

Many DBAs are familiar with the scripts done by the well-known Swedish DBA Ola Hallengren. Many considered the "gold standard" for SQL Server maintenance scripts. https://ola.hallengren.com/. But even that can be improved, especially for larger sites where full-scale deployment can be a big challenge.

High-Maintenance DIY Solutions

No article on monitoring can be completed without mentioning DIY monitoring scripts and tasks. Many DBAs enjoy writing their utilities, and some are quite good at it. But it comes with a price.

Many DIY (or roll-your-own) solutions cause eventual maintenance headaches. The problems arise when you don't remember who built the solution or the person who built it can't maintain it anymore. In many cases, the architect wasn't an expert in database or performance monitoring, which can result in glaring functionality shortcomings.

Summary

Monitoring can be a simple task or a complex and exhaustive process for full control over larger complex estates depending on your ambition and needs.

What you decide to implement will depend on the organization's requirements, your budget, and your skills.

If you do decide to invest in a 3rd party solution, there are many things to consider that we have highlighted here. Since you will usually live for a long time with an investment in a monitoring solution, you need to spend some time deciding what you need now ( and in the future as things grow and expand) before you jump in.

The cost of a monitoring solution can be considerable, but so can the benefits.

Look for capabilities for preventive operations, performance management, resource utilization, and, most importantly, much-improved productivity and DBA satisfaction.

Get started with dbWatch 30 day free trial